Getting Started
From sign-in to your first alert in about five minutes. You'll create an integration API key, fire a test alert with curl, and watch it land in the console.
- An OpsPing workspace and an account with the admin role. Create or open your workspace, then invite the responders who should receive pages.
curlon any machine that can reach your OpsPing API.- Your API base URL —
https://api.opsping.comfor cloud, or your private deployment's address.
-
Sign in to the admin console
Open your OpsPing URL and sign in with your team account email and password. For configured SSO, enter your team slug in the SSO section below the password form, then select Sign in with SSO.
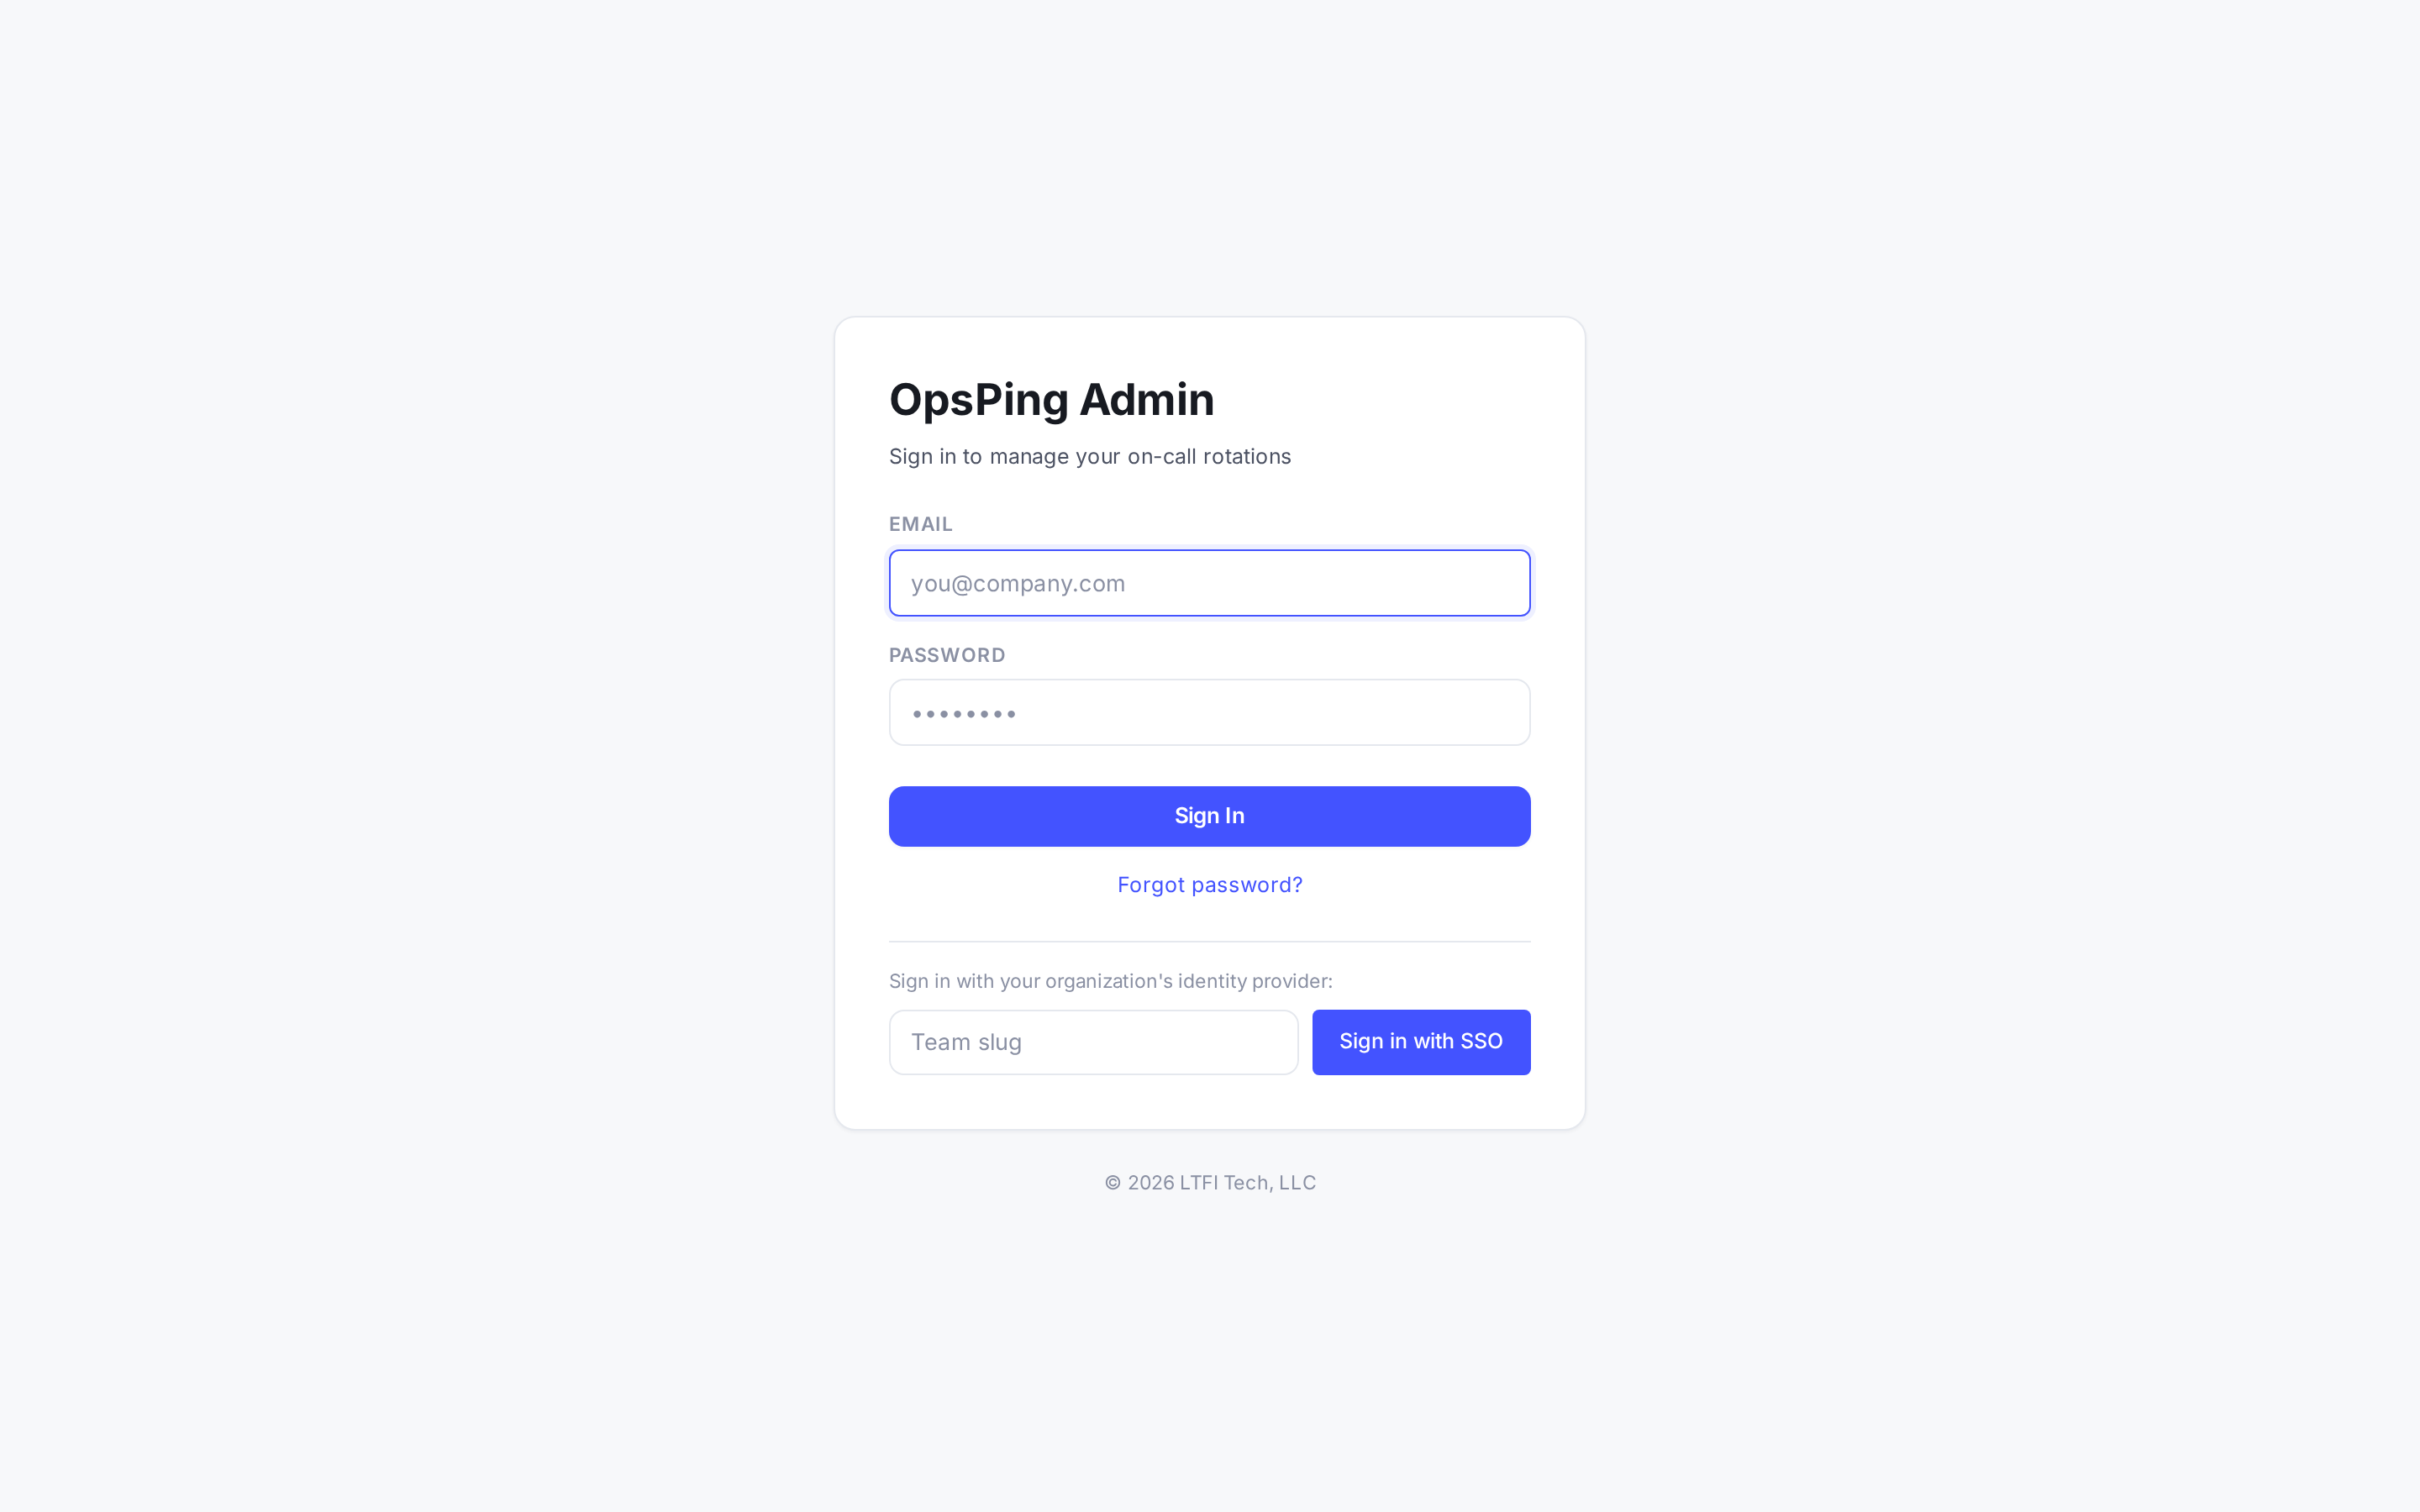
The sign-in page always shows password and SSO paths. Your team must have configured SSO before the latter succeeds. -
Get your bearings on the dashboard
Returning users land on the dashboard: open and acknowledged alerts, incidents, service health, recent alerts, and on-call coverage. New accounts may first see the six-step setup guide described below.
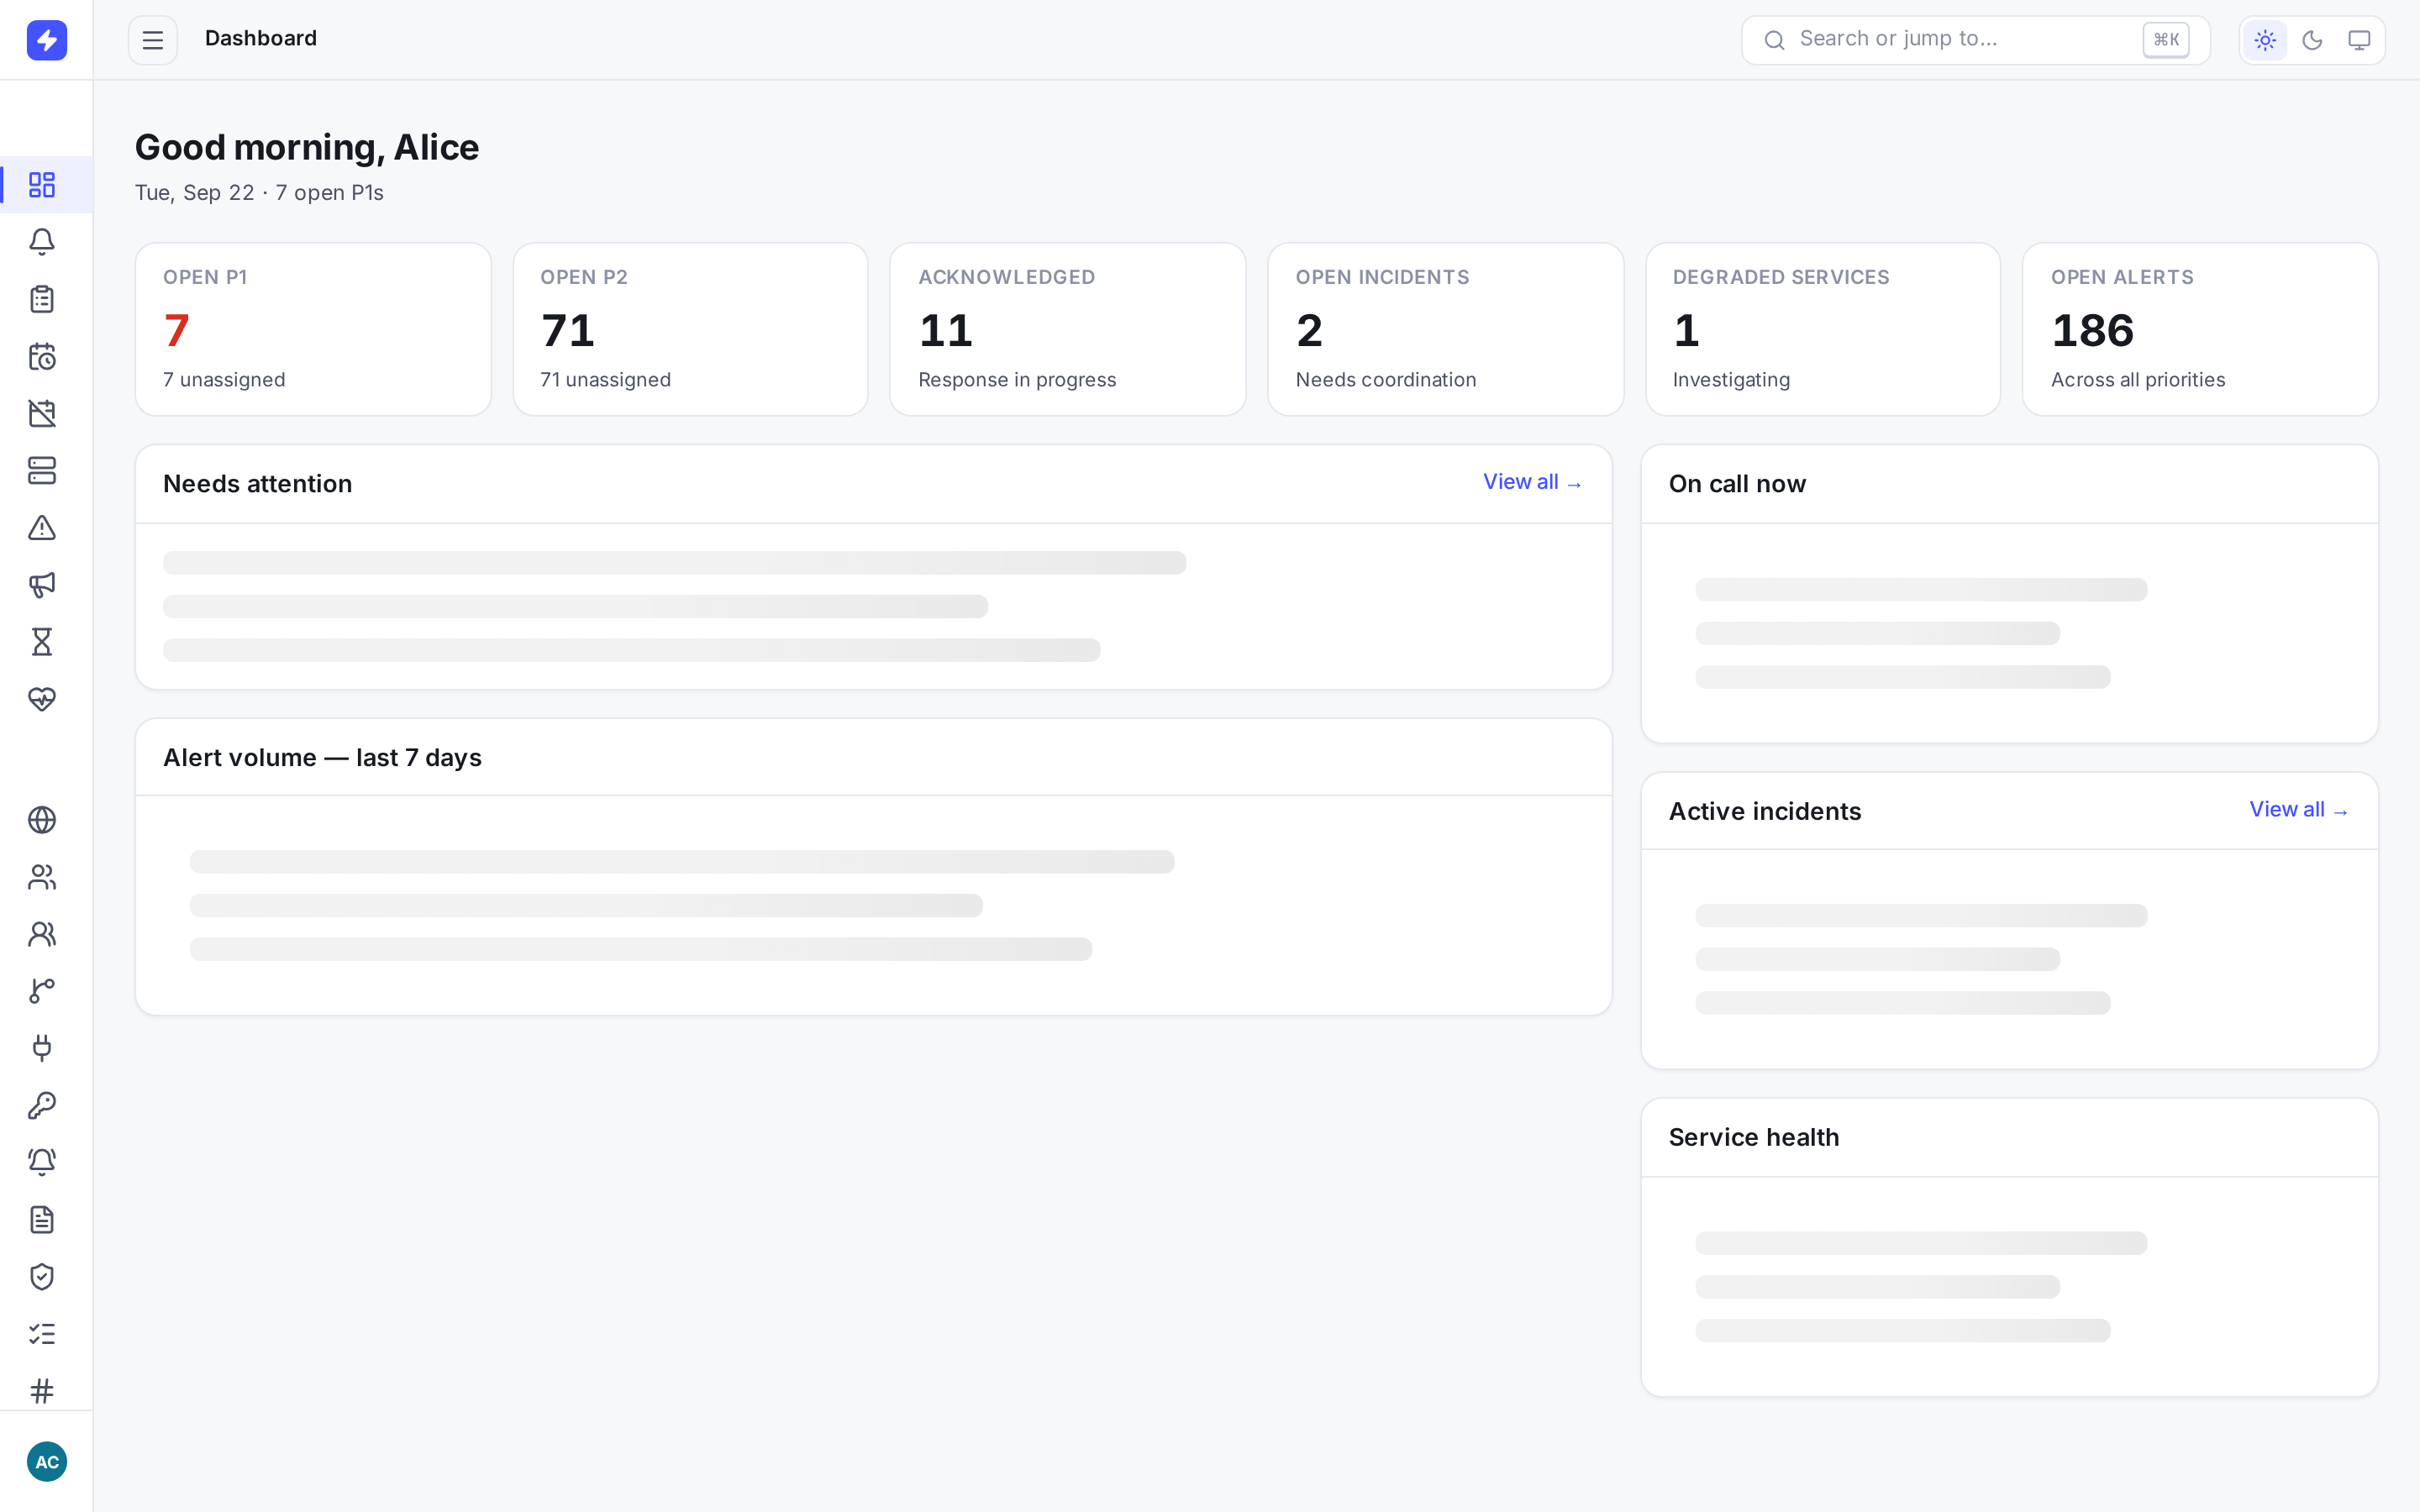
The dashboard gives an at-a-glance view: open and acknowledged alerts, open incidents, degraded services, recent alerts, and who is on call right now. TipThe console follows your system theme by default. Choose Light, Dark, or System from the top-bar Theme control; the preference is remembered per browser.
-
Use the setup guide on first sign-in
New accounts may first see a six-step setup guide. It introduces teammates, schedules, escalation policies, services, and a test alert. Use the sidebar to create those resources: the current schedule, escalation, and service steps explain what to do but do not create them for you. Create an integration before using the test-alert step.
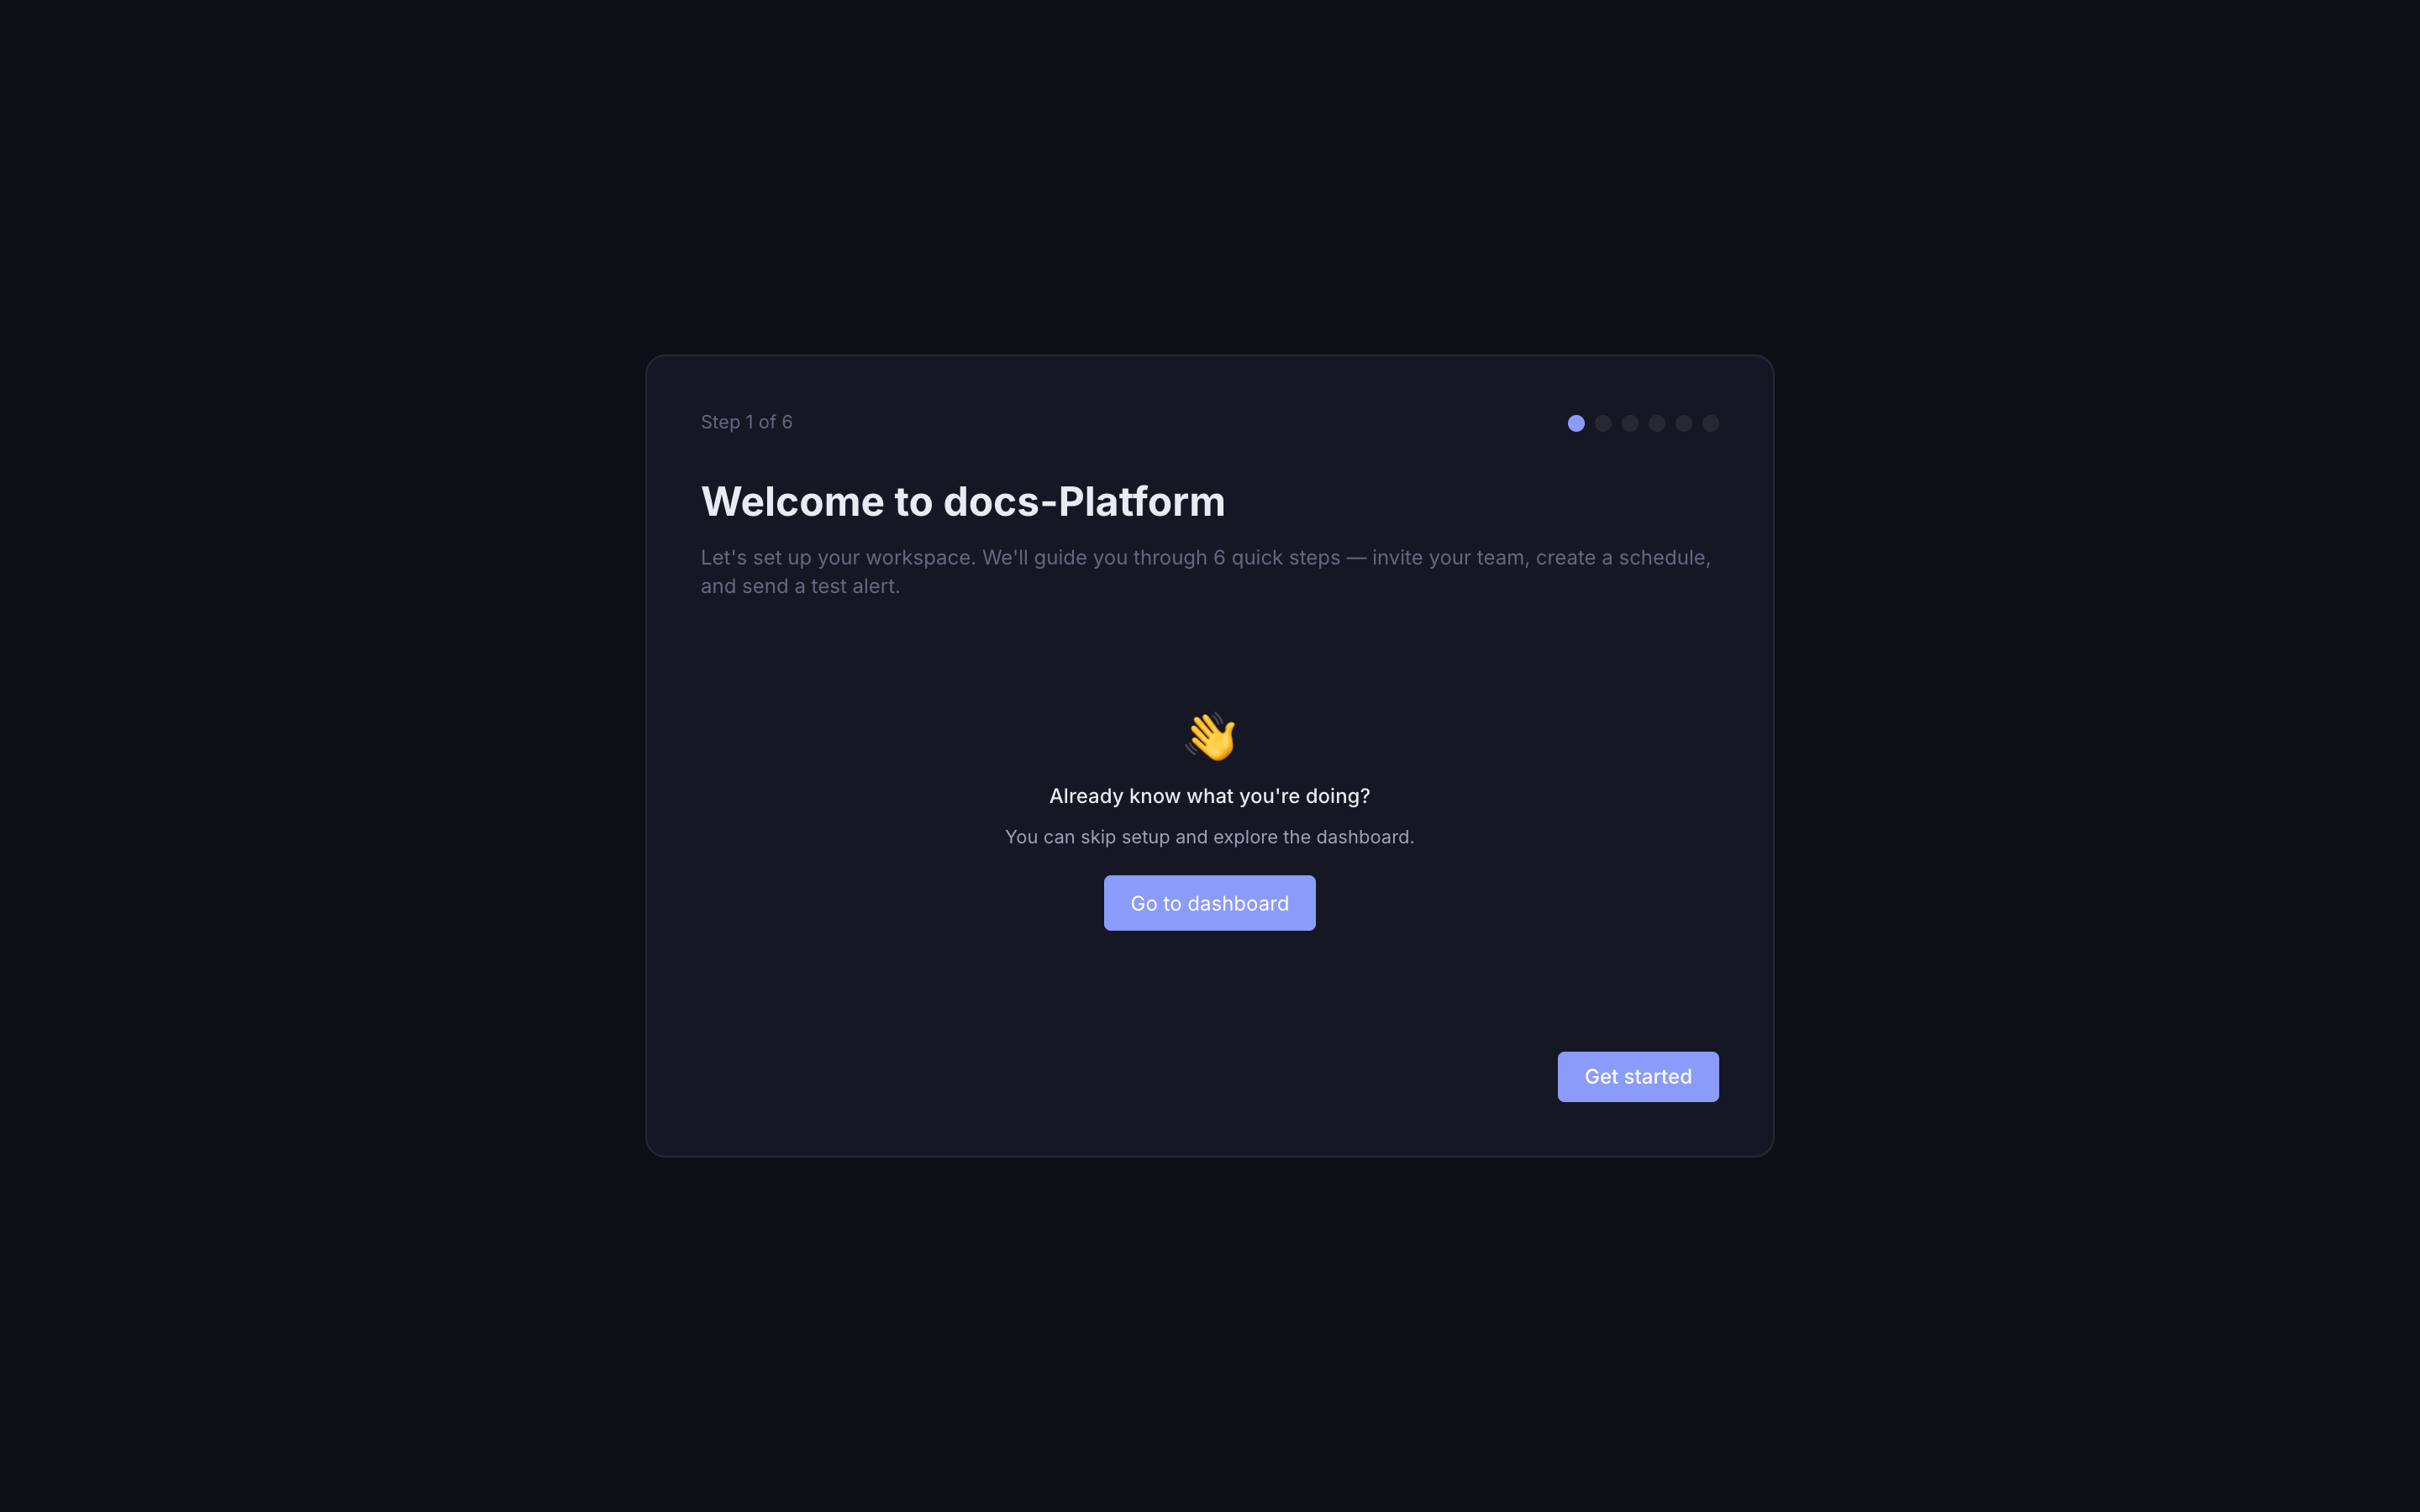
The setup guide introduces the core configuration sequence. You can replay it from Settings → Setup guide. NoteThe guide is orientation, not an automated provisioner. Complete the corresponding forms in Schedules, Escalations, Services, and Integrations.
-
Create an integration
Go to Integrations in the sidebar and select + Create. Give it a source-specific name (for example,
prometheus-prod), choose its type, and set scopes: write creates alerts and performs actions such as close, read queries them, and delete permanently deletes them. For a source dedicated to one system, choose that system as the Default service; incoming alerts then inherit its application icon when the payload omitsserviceId.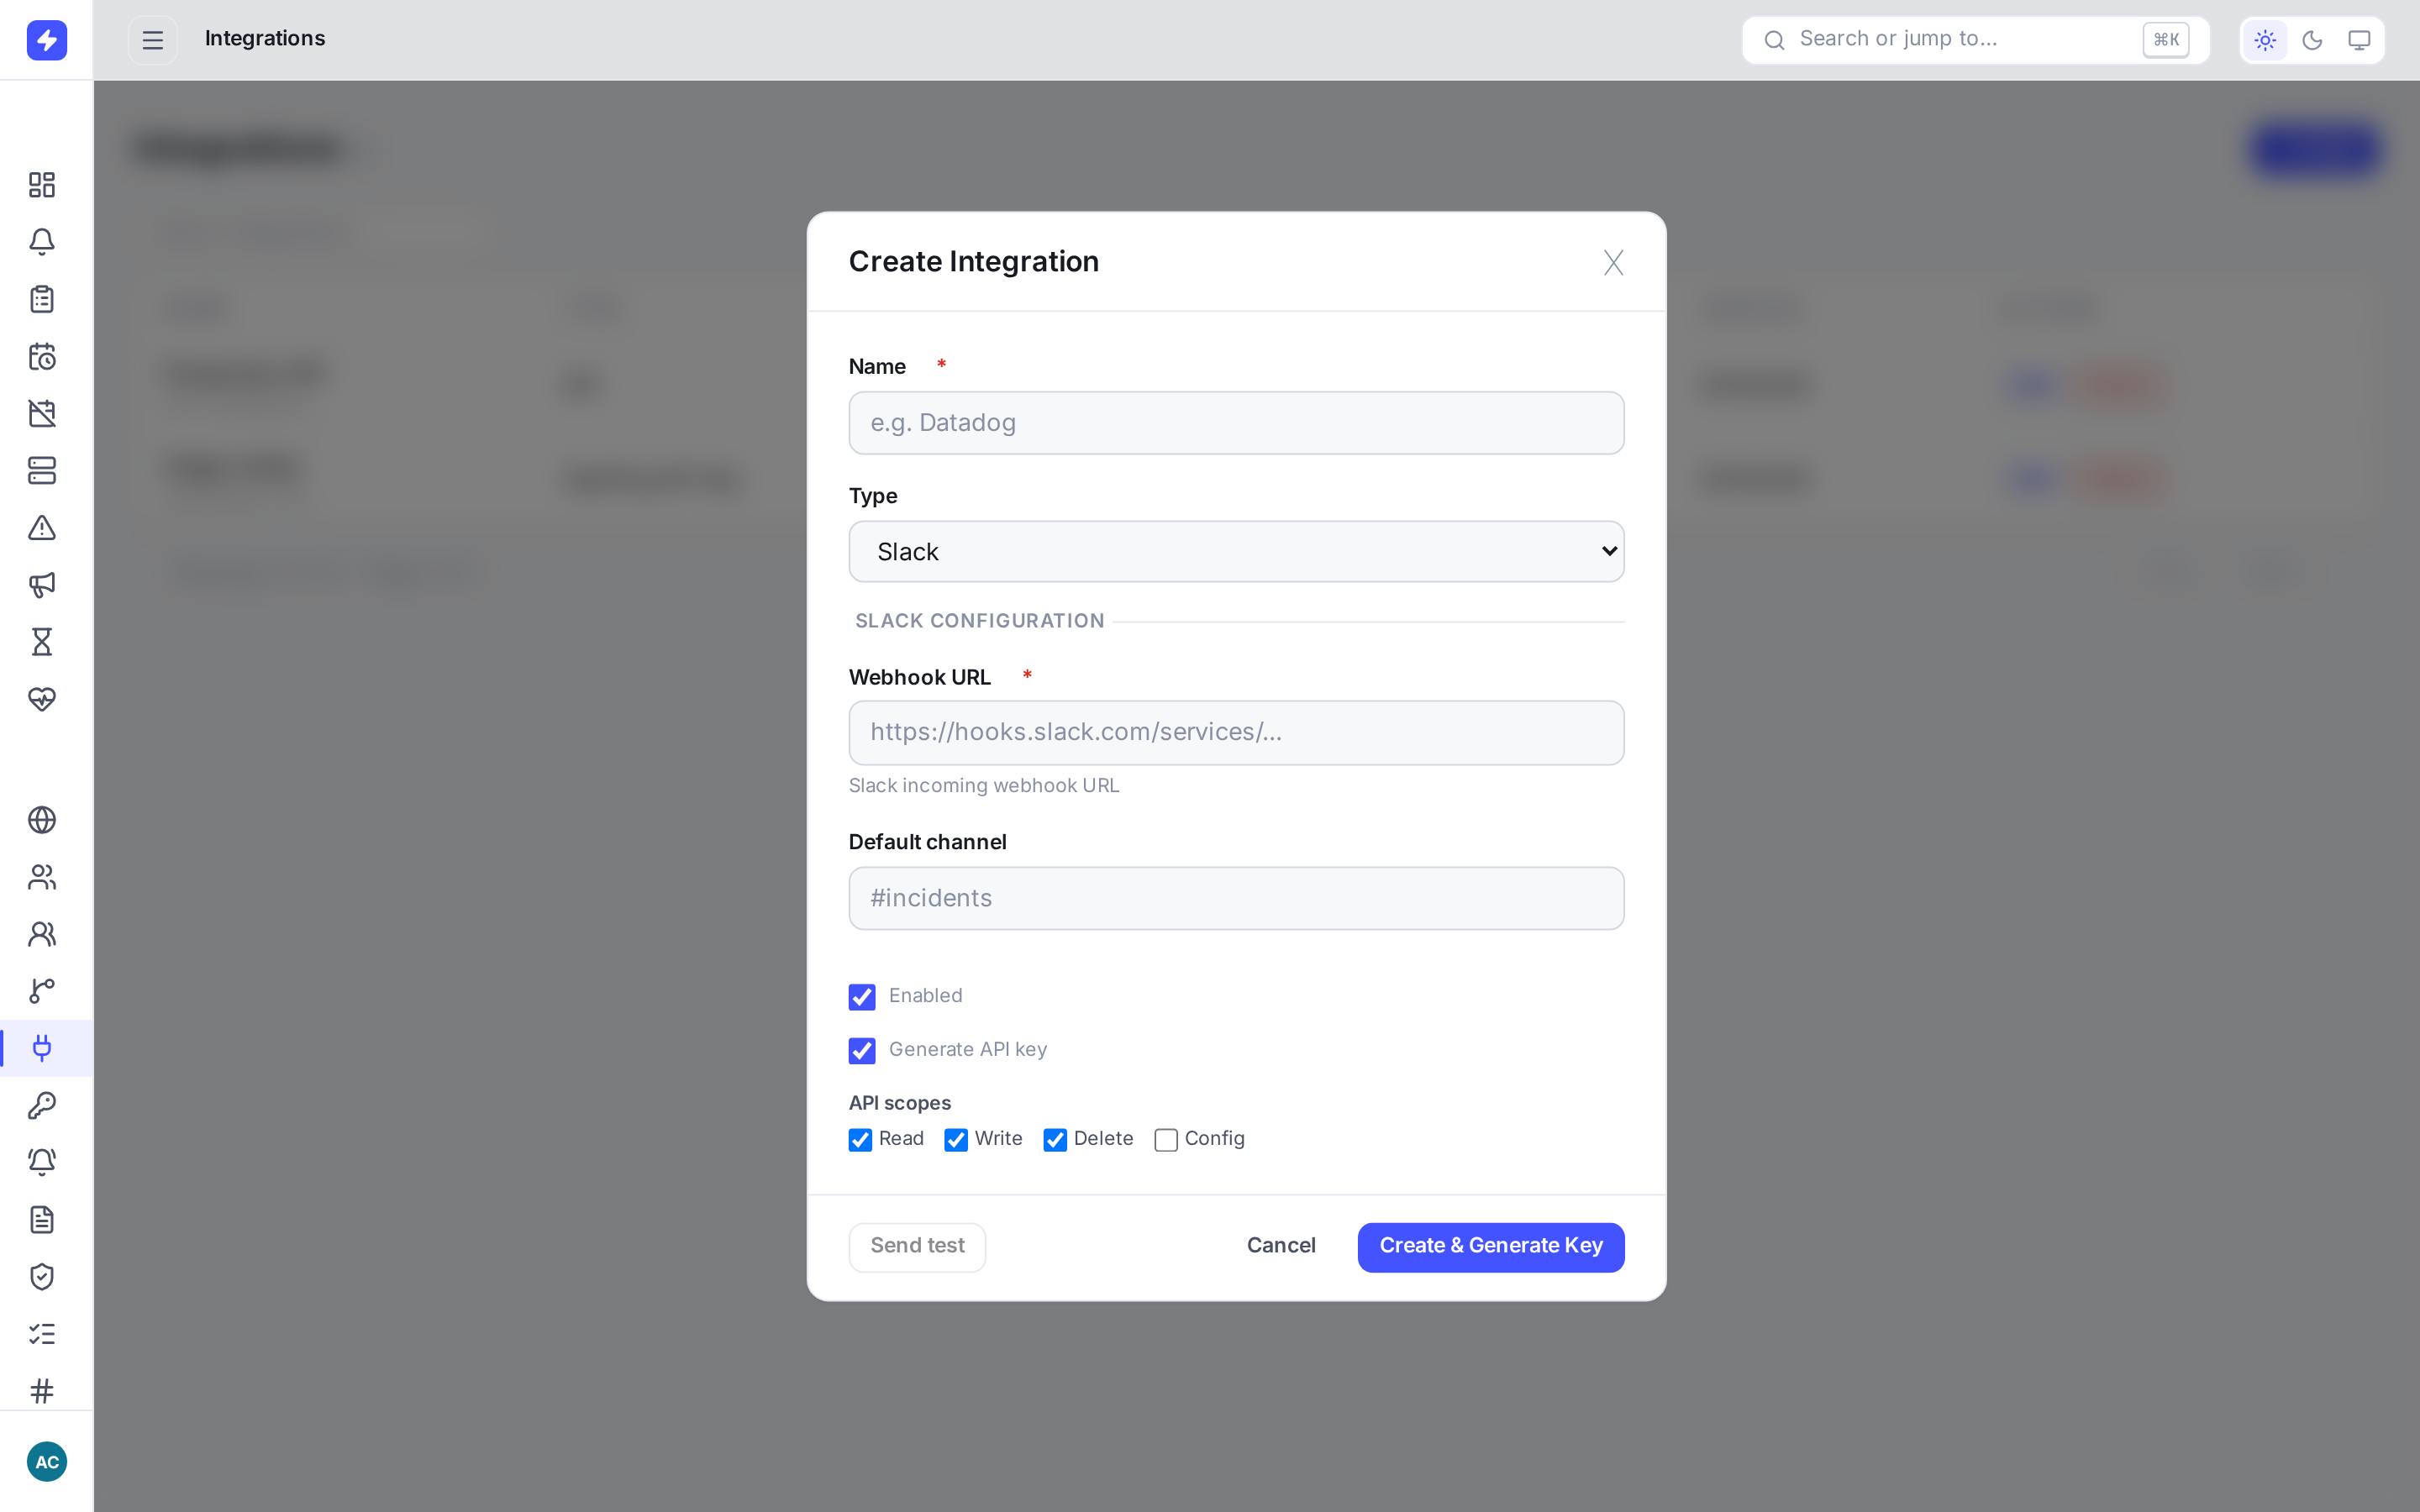
Pick the source type, optionally link a default service, set the minimum scopes, and generate the API key. -
Copy the API key — now
OpsPing shows the generated API key exactly once, immediately after creation. Copy it into your secrets manager before closing the dialog.
WarningThe key is stored hashed and cannot be recovered later. If you lose it, regenerate the key on the integration — the old key stops working the moment the new one is issued.
-
Send your first alert
Authenticate with the
OpsPingKeyscheme and post an alert:curl -X POST https://api.opsping.com/v2/alerts \ -H "Authorization: OpsPingKey YOUR_API_KEY" \ -H "Content-Type: application/json" \ -d '{"message": "Test alert — setup complete", "priority": "P3"}'A
202response with a body like{"result":"Request will be processed","alertId":"…"}means ingestion succeeded.401means credentials are missing or invalid;403means the key lacks scope or access;429means rate limiting — back off and retry.NoteMigrating from Opsgenie? OpsPing accepts the
GenieKeyheader scheme, but you must point the tool at OpsPing and use an OpsPing-generated key. See the Migration guide. -
See it in the alerts list
Open Alerts in the sidebar. Your test alert sits at the top in the Open state. Click it to acknowledge, add a note, or close it — the full lifecycle is covered in Alert triage.
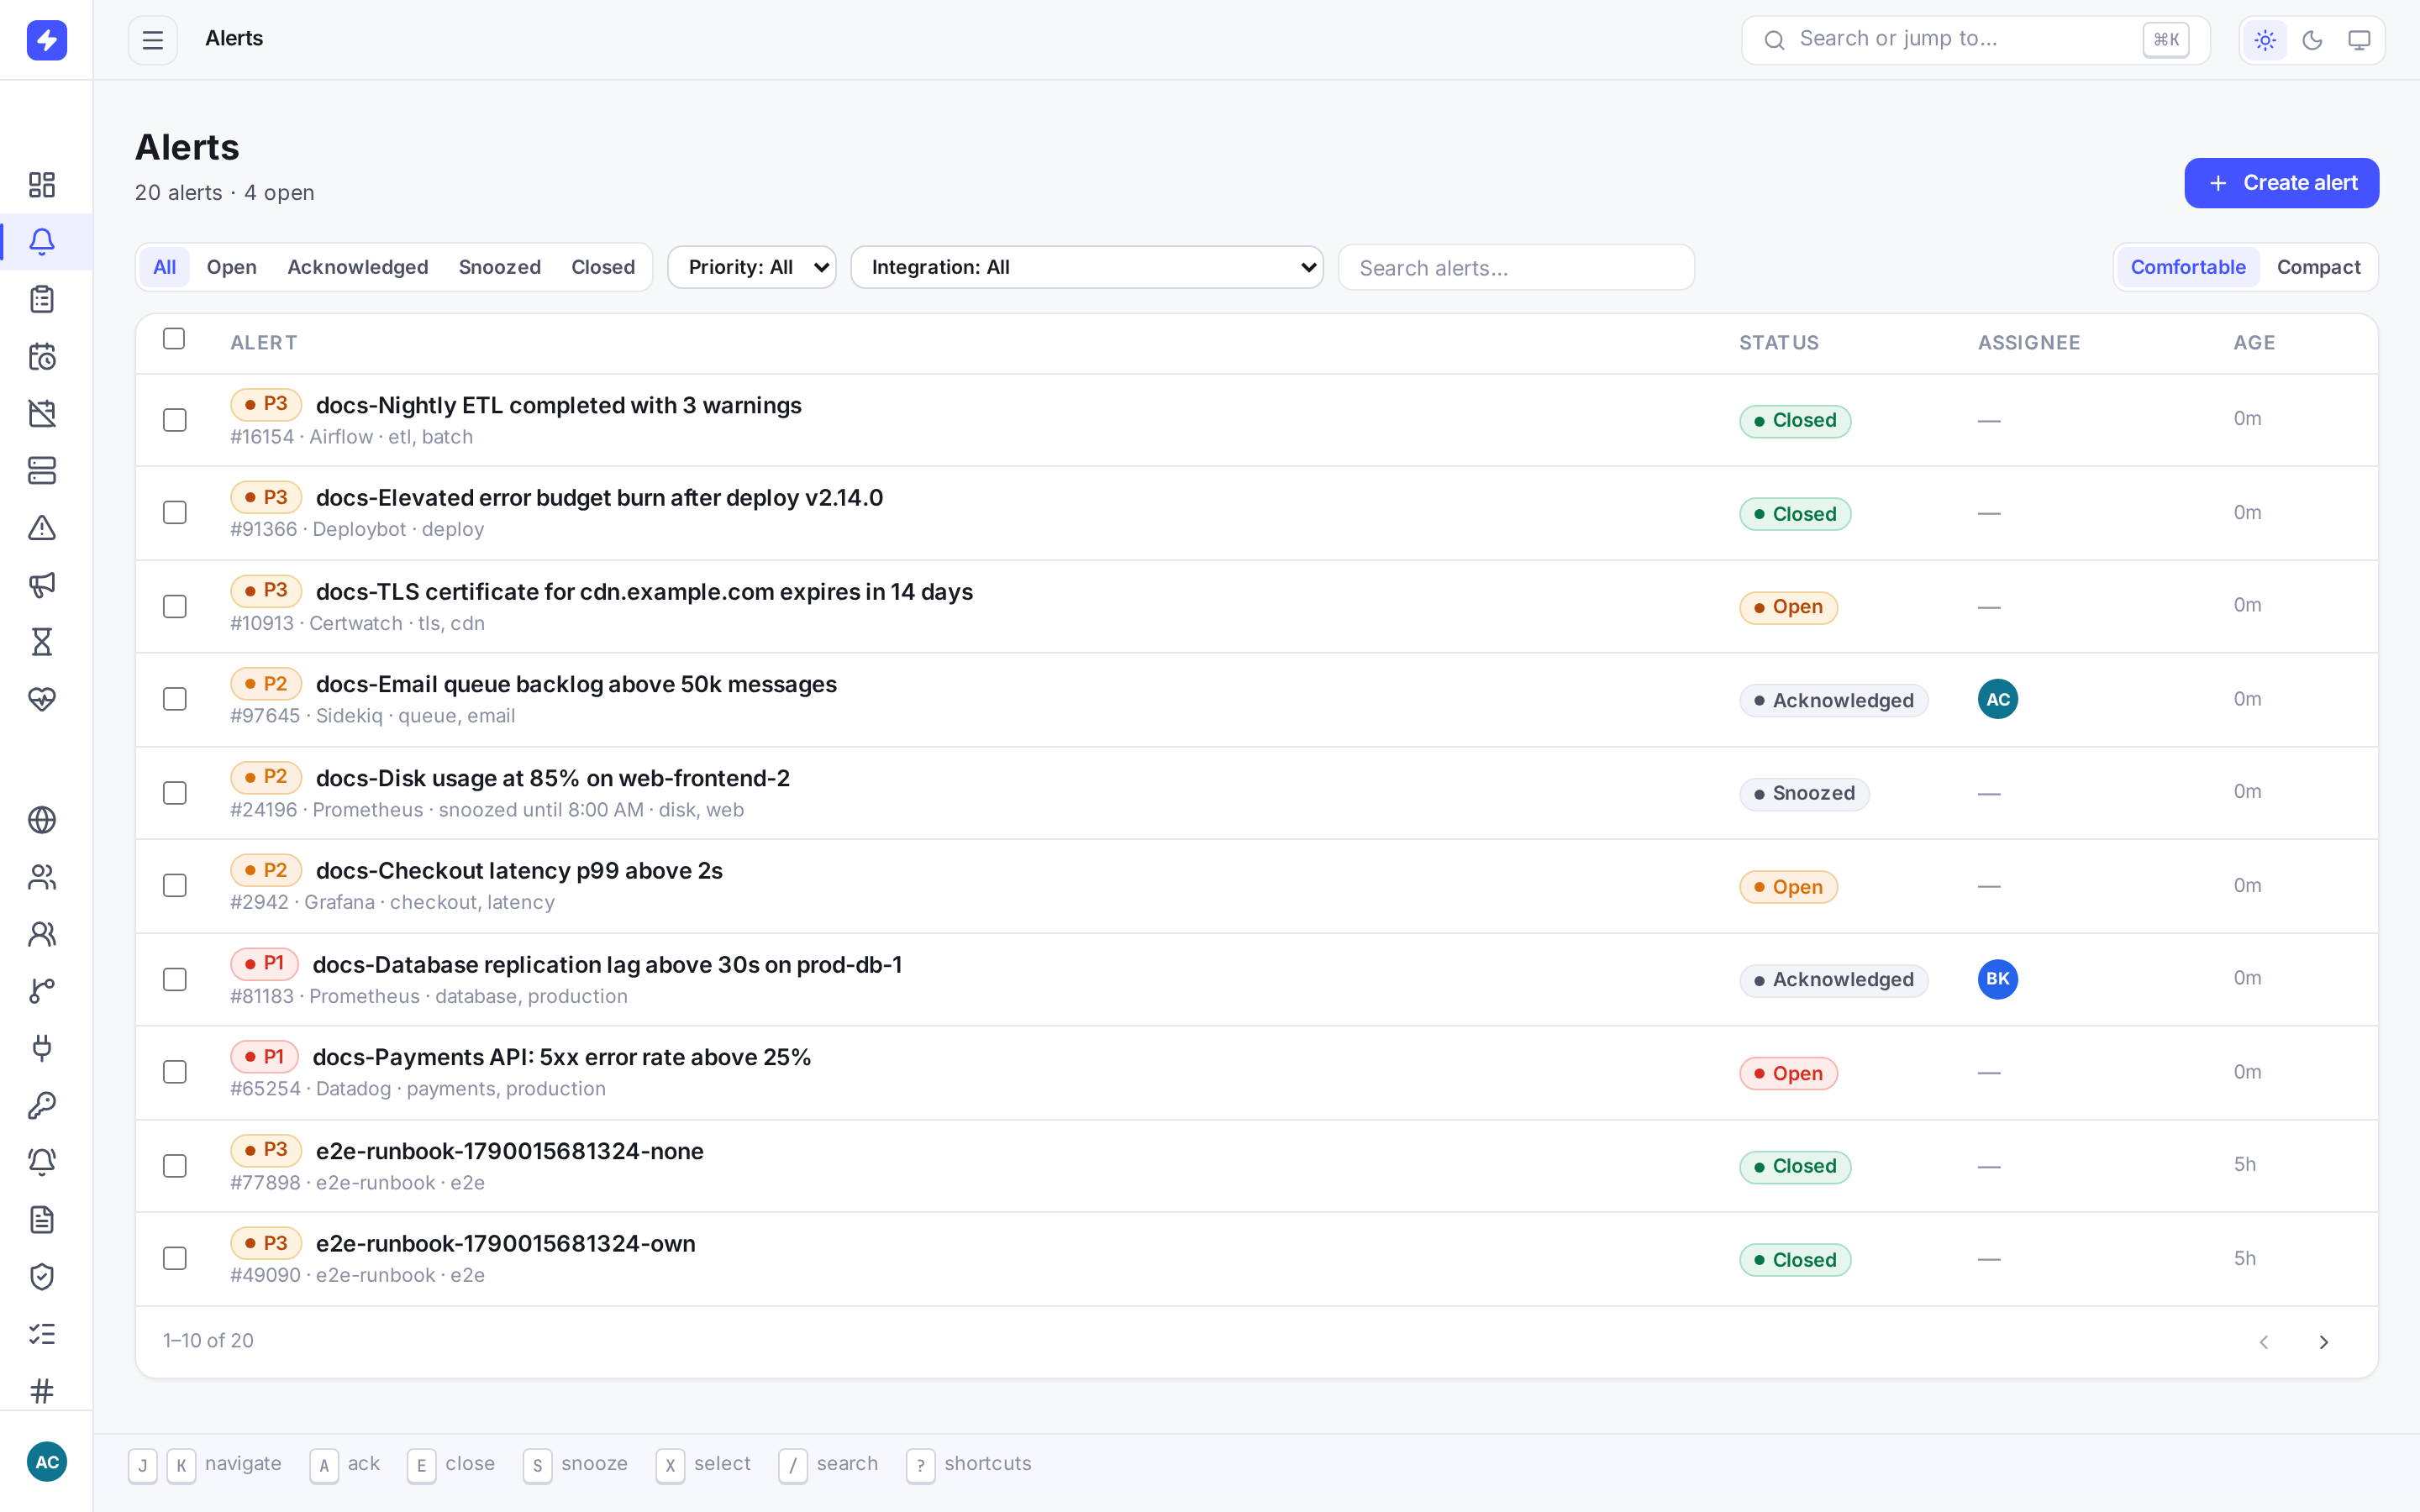
The alerts list with the status filter set to All. Use the chips to filter by Open / Acknowledged / Closed, and the search box for full-text filtering. You're live. Point your real monitoring tool at the same endpoint and the next alert that fires will page whoever is on call.