Inbound integrations
Alerts have to come from somewhere. OpsPing gives every integration its own webhook URL — the URL is the credential, no API key needed at the sender — and maps payloads from the common monitoring tools automatically. Anything that can POST JSON or send email can page you.
- Admin access to create integrations (Teams & administration → Integrations).
- A source that can POST JSON — a monitoring tool, a script, or
curl.
-
Create the integration and copy its webhook URL
On the Integrations page, create an inbound integration and choose the source type — for example Grafana, Datadog, AWS CloudWatch (SNS), or Google Cloud Monitoring. Use an OpsPing API Key integration for native OpsPing JSON or auto-detected Alertmanager payloads. Generic Webhook is an outbound-delivery integration, not an inbound mapper. For a source dedicated to one system, choose a Default service; mapped alerts that omit
serviceIdinherit that service and its application icon. Each inbound integration gets a unique webhook URL:https://api.opsping.com/v2/webhooks/inbound/<integrationId>/<token>The token is minted on creation and lives in the URL — treat the URL like a password. Anyone who has it can create alerts in your tenant. If it leaks, rotate it from the integration's page (the old URL stops working immediately).
NoteOne integration per source system. Keeping Grafana and Datadog on separate integrations keeps alert provenance, rate limits, and team scoping clean — each integration can be assigned to a team.
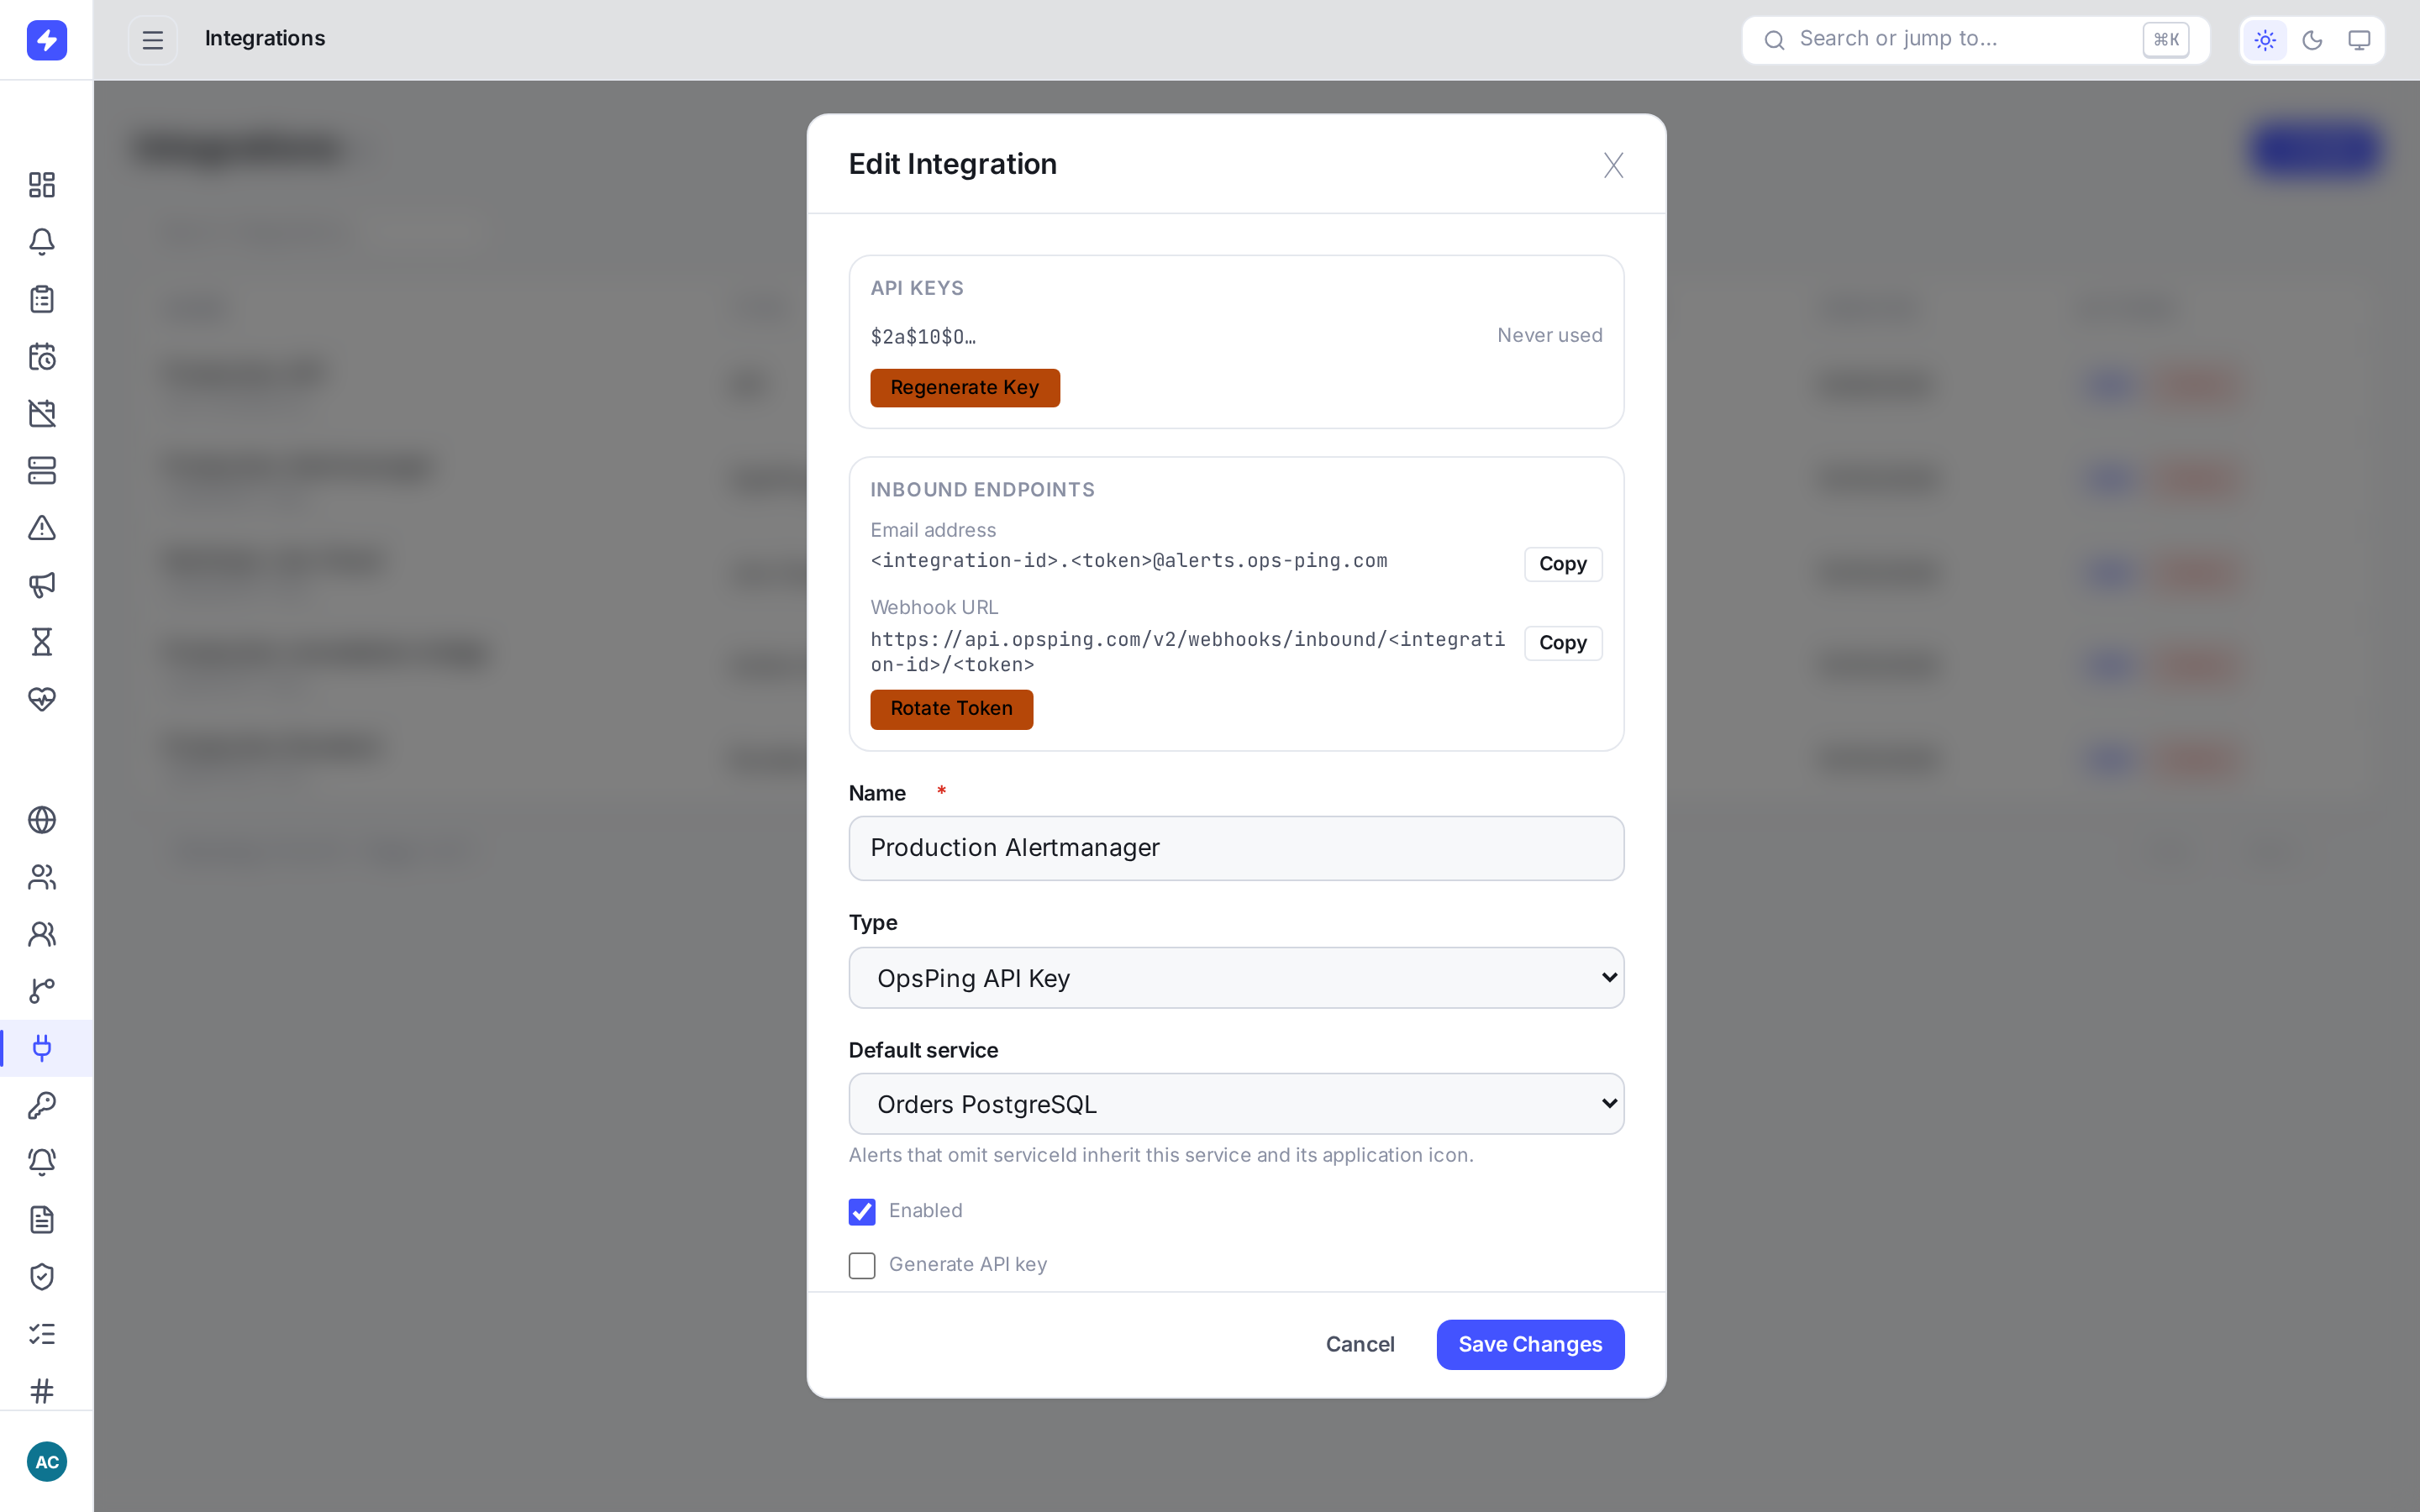
The integration's default service links mapper-created alerts to the service catalog. The service's PostgreSQL icon then appears in the alert queue and mobile app. -
Post native JSON directly
The simplest path: POST an OpsPing alert body. No mapper involved — the body is validated against the alert schema and stored as the alert.
curl -X POST https://api.opsping.com/v2/webhooks/inbound/<id>/<token> \
  -H "Content-Type: application/json" \
  -d '{"message":"Payments API error rate 12%","priority":"P1","alias":"payments-errors","tags":["payments"],"description":"5xx spike since deploy 4471"}'
Fields:
message(required, 1–130 characters),priorityP1–P5,alias,tags,entity,description,serviceId(must reference a service in your tenant — an unknown or foreign-tenant id is rejected with 400), anddetailsas a string-to-string object. Serialize numeric or structured detail values before sending them. The integration's name is stamped as the alert'ssourcefor every feed type, so alert policies that match onsourcework consistently. Creation follows the same path as the alerts API, including dedupe, routing, alert policies, escalation, and push. Rate limit: 300 requests per minute per integration. -
Send alerts from GitHub Actions
GitHub does not have a native inbound alert integration here. Use a GitHub Actions workflow to POST the alert fields
message,alias, andpriorityto the OpsPing API. Put the API key in a GitHub Actions secret, not in the workflow file:- name: Notify OpsPing if: failure() env: OPSPING_API_KEY: ${{ secrets.OPSPING_API_KEY }} OPSPING_API_URL: https://api.opsping.com run: | curl --fail-with-body -X POST "$OPSPING_API_URL/v2/alerts" \ -H "Authorization: Bearer $OPSPING_API_KEY" \ -H "Content-Type: application/json" \ -d '{"message":"GitHub Actions workflow failed","alias":"github-actions-${{ github.run_id }}","priority":"P2"}'Set
OPSPING_API_URLto your API base URL. For repository deployment and release correlation, use the native GitHub deployment linking described in the Deployments guide. -
Use a mapper for your monitoring tool
Point the tool's webhook at the same URL and OpsPing recognizes the payload shape. Detection is automatic — you rarely need to set the type explicitly.
- Grafana — the Grafana alerting webhook sends
{ "alerts": [...] }, the same shape as Alertmanager. Each entry mapslabels.alertname→ message,labels.severity→ P1–P5, and the alert's fingerprint → alias. The GrafanaexternalURLis carried into details so the alert links back to the panel. - Prometheus Alertmanager — v4 webhook payloads, same
alertsarray.alertname→ message,severitymapscritical/error/warning/info/debugto P1–P5 (missing or unknown → P3),fingerprint→ alias.resolvedentries close the matching alert; labels and annotations land in details. - CloudWatch via SNS — point the SNS topic's HTTPS subscription at the webhook URL, then complete the SNS subscription confirmation separately. OpsPing acknowledges confirmation messages but does not confirm the subscription for you. The SNS envelope is unwrapped automatically;
ALARMcreates an alert (aliascloudwatch:<AlarmName>, P3, reason as description),OKcloses it, andINSUFFICIENT_DATAcreates no alert. - Google Cloud Monitoring — native incidents use
incident.incident_idas aliasgcp:<id>.opencreates or updates the alert andclosedresolves it. Critical, error, warning, and info severities map to P1–P4; missing or unknown severity defaults to P3. - Datadog — the monitor webhook:
title→ message,body→ description,alert_id→ alias (datadog-<id>),alert_type→ priority. ARecoveredtransition closes the alert the earlierTriggeredone opened. - Native or auto-detected JSON — an OpsPing API Key integration accepts the native alert fields above and auto-detects supported payload shapes such as Alertmanager. Unknown native fields are ignored. A shell script with
curlis fully supported.
When a payload contains multiple alerts (Grafana and Alertmanager send arrays), each entry is processed individually and the response tallies the outcomes:
{ "result": "processed", "created": 2, "deduped": 1, "closed": 1, ... }.TipThe alias is what makes the loop close. Firing creates an alert with alias X; resolved/OK/Recovered closes whatever alert currently owns alias X — even if it's already been acknowledged. Give your monitors stable identifiers (fingerprints, alarm names, monitor IDs) and open-and-close just works.
NoteDedupe is alias-based: if an alert with the same alias is already active, another firing updates that alert and increments its occurrence count instead of creating a second row. It can send another push; acknowledgement, snooze, active maintenance, or integration-level notification suppression prevents that re-push. Stable aliases also let recovered payloads close the right alert.
- Grafana — the Grafana alerting webhook sends
-
Prove the full path with Alertmanager
This reproducible smoke runs a real Prometheus Alertmanager container, submits a critical database alert to its v2 API, and lets Alertmanager deliver the v4 webhook to OpsPing. Before running it, create an OpsPing API Key integration named Production Alertmanager, set Orders PostgreSQL as its default service, and copy the inbound webhook URL.
Save this configuration as
alertmanager.yml, replacing the URL with the one-time endpoint copied from OpsPing:global: resolve_timeout: 1m route: receiver: opsping group_by: [alertname] group_wait: 1s group_interval: 1s repeat_interval: 1h receivers: - name: opsping webhook_configs: - url: 'https://api.opsping.com/v2/webhooks/inbound/<id>/<token>' send_resolved: trueStart Alertmanager. This example uses Podman on Linux; with Docker, replace
podmanwithdockerand change the mount suffix from:ro,Zto:ro.podman run --rm -d \ --name opsping-alertmanager \ -p 127.0.0.1:9093:9093 \ -v "$PWD/alertmanager.yml:/etc/alertmanager/alertmanager.yml:ro,Z" \ docker.io/prom/alertmanager:v0.28.1 \ --config.file=/etc/alertmanager/alertmanager.yml curl --fail http://127.0.0.1:9093/-/readySubmit the alert to Alertmanager — not directly to OpsPing:
STARTS_AT="$(date -u +%Y-%m-%dT%H:%M:%SZ)"
ENDS_AT="$(date -u -d '+10 minutes' +%Y-%m-%dT%H:%M:%SZ)"

curl --fail-with-body -X POST http://127.0.0.1:9093/api/v2/alerts \
  -H 'Content-Type: application/json' \
  -d "[{
    \"startsAt\":\"$STARTS_AT\",
    \"endsAt\":\"$ENDS_AT\",
    \"labels\":{
      \"alertname\":\"Orders PostgreSQL replica lag above 30 seconds\",
      \"severity\":\"critical\",
      \"instance\":\"orders-db-1\",
      \"service\":\"orders-postgresql\"
    },
    \"annotations\":{
      \"summary\":\"Replica lag exceeds 30 seconds\",
      \"description\":\"Streaming replica orders-db-1-replica is 47 seconds behind the primary.\"
    },
    \"generatorURL\":\"https://grafana.example.com/alerting/orders-postgresql\"
  }]"
Within a few seconds, OpsPing shows one open P1 sourced from Production Alertmanager. Because the integration supplies the default service, the row uses the PostgreSQL application icon. The documentation capture pipeline executes this exact container flow before taking the screenshot below; it does not POST a fixture directly to OpsPing.
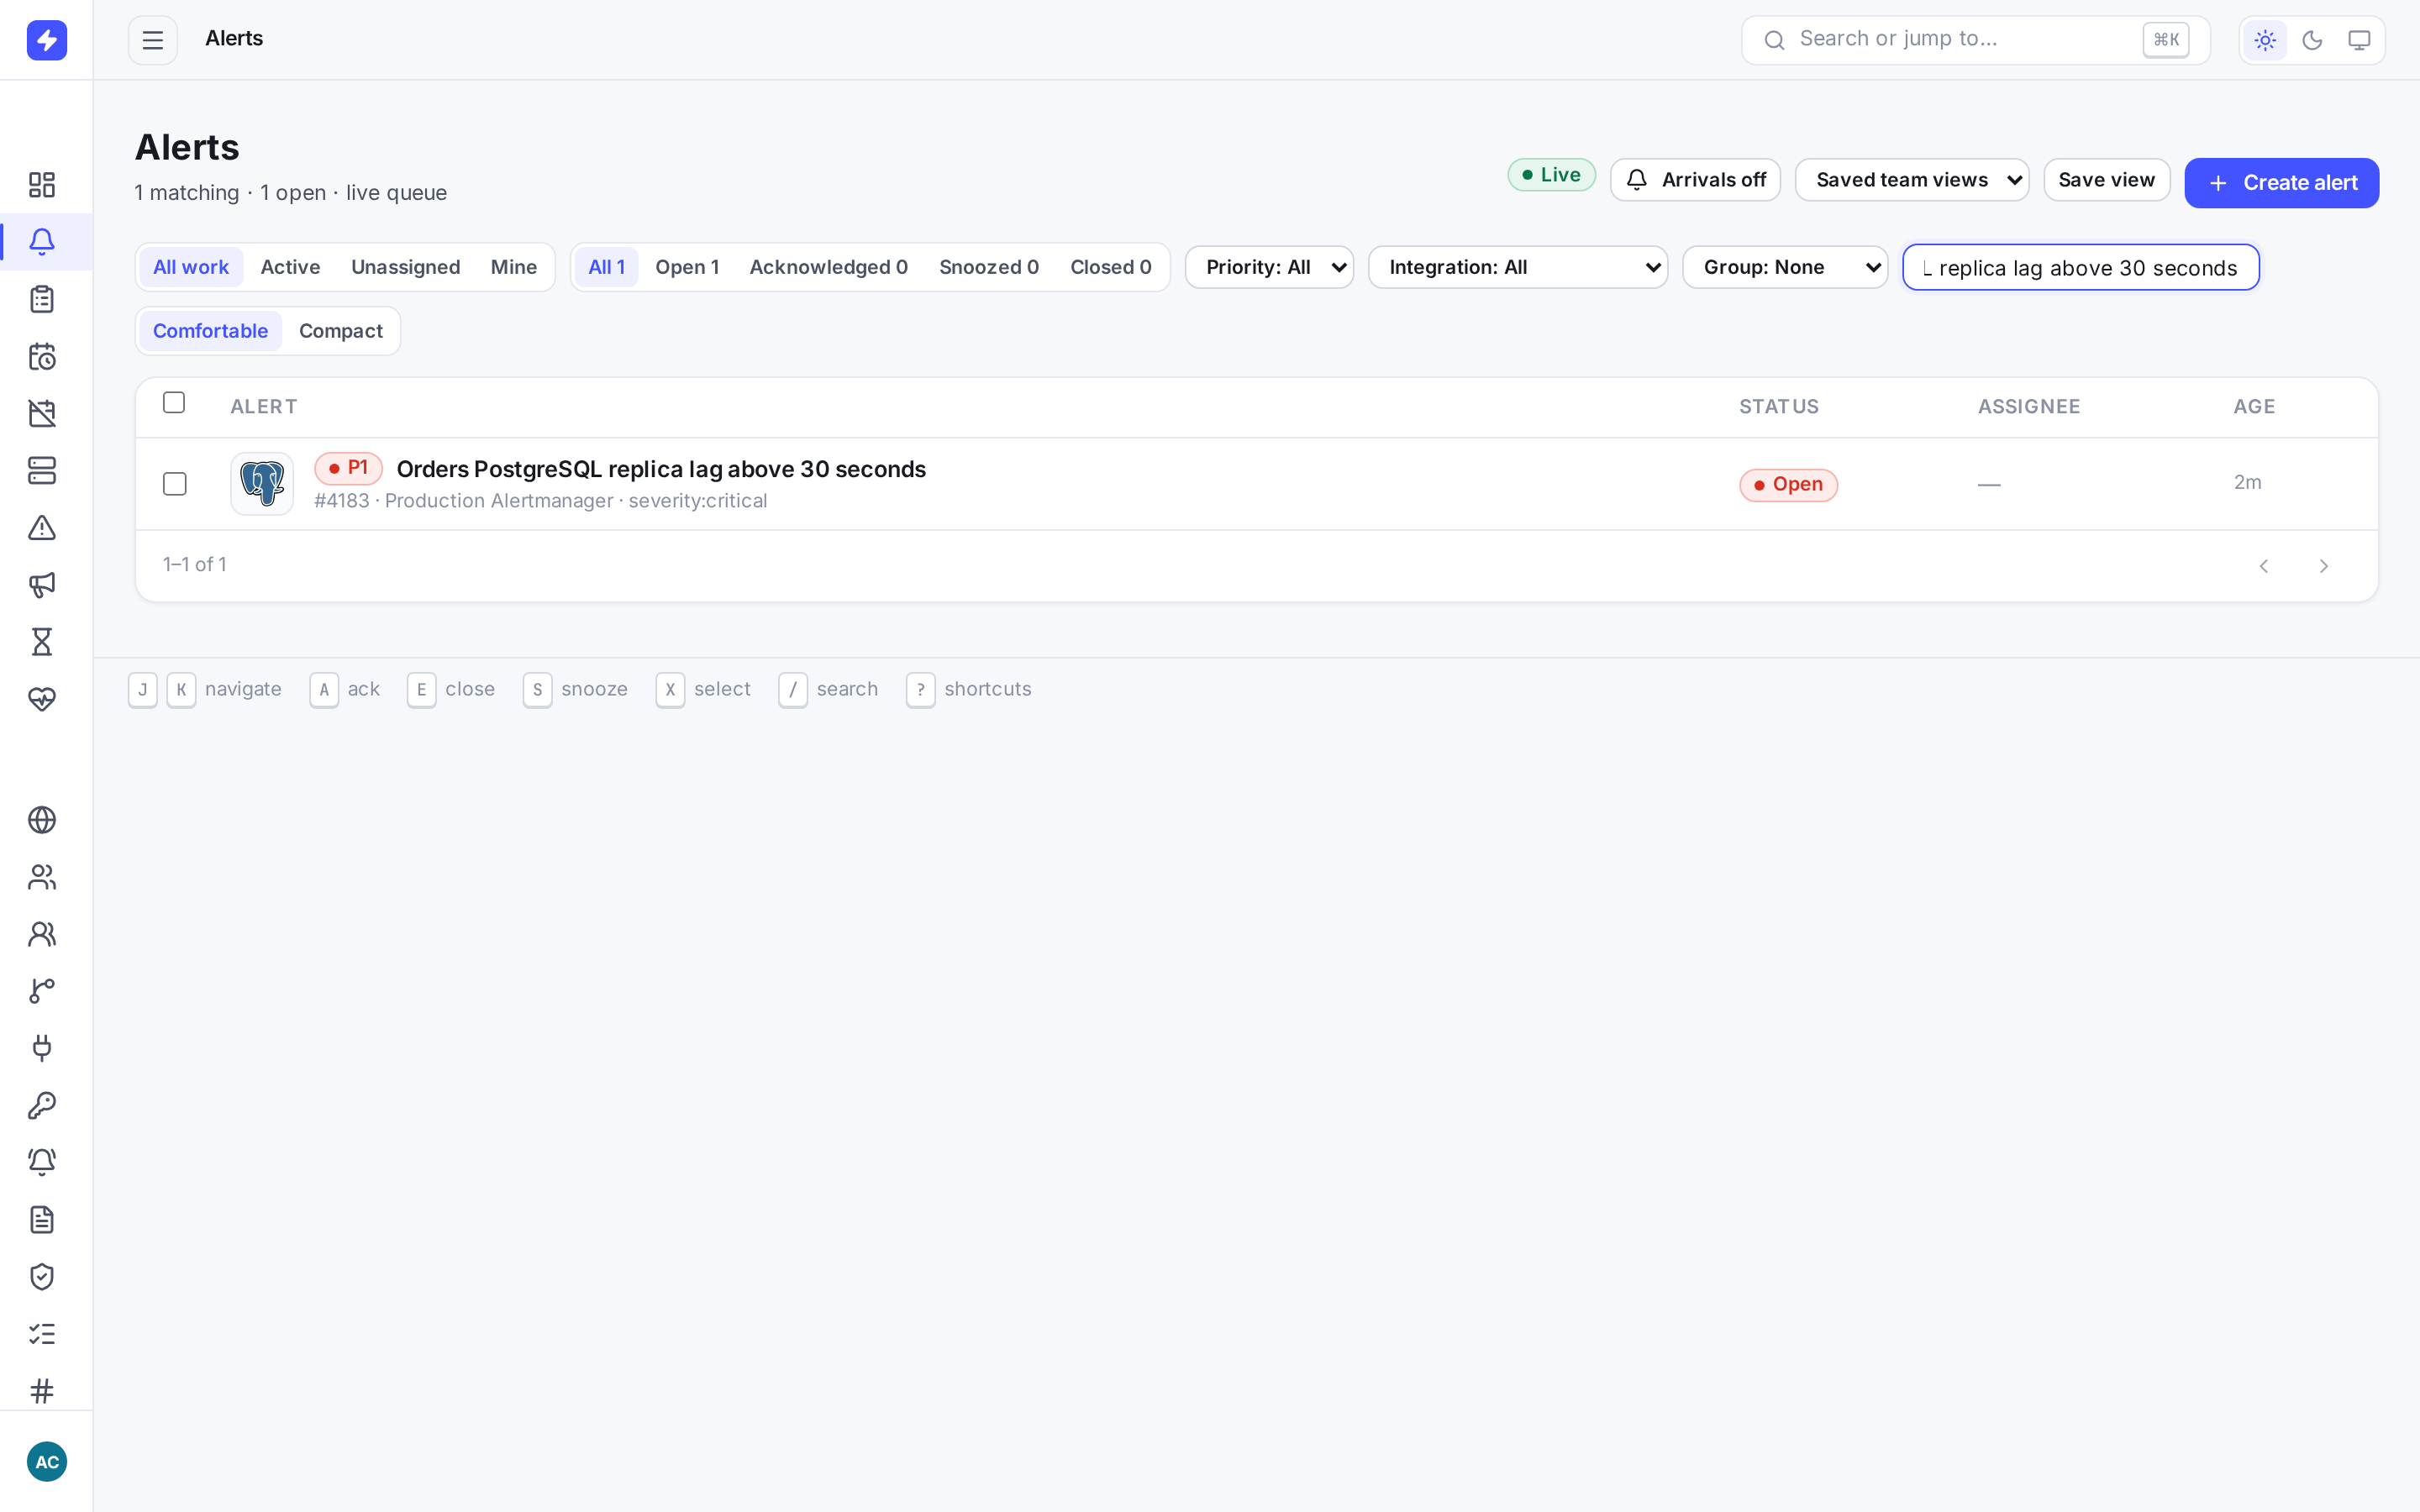
End-to-end result: Alertmanager accepted the alert, grouped it, sent the webhook, and OpsPing linked it to Orders PostgreSQL. One integration per service gives the clearest iconsAlertmanager's standard payload has no OpsPing
serviceIdfield. If one Alertmanager routes alerts for many systems, create one OpsPing receiver/integration per service and route to the matching receiver. For native JSON, a valid payloadserviceIdoverrides the integration default.Stop the smoke container when finished:
podman rm -f opsping-alertmanager -
Page by email
For tools that can only send mail — legacy monitors, cron jobs, a colleague's script — each integration gets an inbound email address:
<integrationId>.<token>@alerts.opsping.comCopy it from the integration's page. Any mail sent to it becomes an alert: the subject line is the message (minus the priority tag), the body becomes the description, and the sender is recorded in details. The alert's
sourceis the integration's name — write that exact value into an alert policy's or notification rule's source match. Set priority with a tag in the subject:Subject: [P2] Nightly ETL failed on step 3[P1]–[P5]are recognized; no tag means P3. Email is create-only — there's no resolve-by-reply, so use the webhook mappers for open/close loops and email for one-way pings.NoteMail with the same
Message-IDdeduplicates into the same active alert. A different ID — including one generated while forwarding — can create another alert, and a repeated message after the earlier alert closes can create a new occurrence. Use the webhook loop when you need deterministic open/close lifecycle handling. -
Mind maintenance windows
Inbound alerts respect maintenance windows. An alert covered by an active service, team, or global window is still stored and gets a
notifications-suppressedactivity entry. Paging, escalation, broadcast push, and re-paging are suppressed; Slack and outbound webhook delivery happen earlier in the intake pipeline and may still receive the alert. The webhook answers 202.WarningSuppression is not deferred paging. OpsPing does not automatically page the stored alert when the window ends. A later firing can update and re-notify that active alert after maintenance; scope windows tightly and verify the monitoring source keeps evaluating the condition.